Can-ALE
Canadian Active Living Environments (Can-ALE 2.0) - 2025 Update
Meisam Ghasedi¹, Daniel Fuller¹, Gorham Achot², Nancy A. Ross²
¹University of Saskatchewan
²Queen’s University
Welcome to the official repository for the Canadian Active Living Environments (Can-ALE) 2.0 project. . This project extends the Can-ALE Original Project to include the 2011, 2016, and 2021 census years.
Introduction
This study replicates and extends the previously developed Can-ALE measures, which were initially available for the 2006 and 2016 census years. This update was accomplished in three primary ways. First, the entire data and code pipeline for the Can-ALE was rebuilt. This was necessary because the original point of interest data used for the 2006 measure was lost. Second, the Can-ALE was produced for the previously unavailable 2011 and 2021 census years, and with these additions, the Can-ALE is now available for 2006, 2011, 2016, and 2021. Although the Can-ALE is now available for four census years, it is not considered reliable for longitudinal analysis. This limitation stems from inconsistencies in the underlying data, such as the progressive completeness of OpenStreetMap (OSM) POIs over time and the availability of transit stop data for only 2016 and 2021. However, the measures can be used effectively to develop and analyze the ALE index for each census year independently. Third, we computed the “walk to work” and “active transportation to work” mode shares for 2011, 2016, and 2021, which allows researchers to examine associations between the Can-ALE measure and these commute rates. While active transportation is typically defined by walking and cycling, this study expands the definition to include public transit. This was done to create a more comprehensive “active and sustainable transport” variable that better aligns with the study’s objectives. These changes aim to enhance the measure’s overall accuracy and relevance by providing a more complete representation of ALEs across Canada.
| Dataset | Data Download |
|---|---|
| 2006 Can-ALE Dataset | CanALE_2006.csv |
| 2011 Can-ALE Dataset | CanALE_2011.csv |
| 2016 Can-ALE Dataset | CanALE_2016.csv |
| 2021 Can-ALE Dataset | CanALE_2021.csv |
Software
All code was written in RStudio (Version 2025.05.1, Build 513), and has been made available as open-source for use in future census years or for other analyses. Additionally, ArcGIS Pro 3.0.1 was used as validation software for all measures to confirm that the results from the R scripts were consistent with those produced by ArcGIS.
Data Collection and Definition
The updated Active Living Environment (ALE) index for 2011, 2016, and 2021 is based on five core measures: weighted population density, weighted dwelling density, transit stop counts, intersection density (≥3 legs), and a weighted points of interest (POI). For detailed definitions and data sources for each of these measures, please refer to Table 1.
Table 1. Definition of Measures and Their Sources
| Measure | Definition | Data Source |
|---|---|---|
| Weighted population density | The number of people per square kilometer within a 1-km circle centered on a Dissemination Area’s (DA) population-weighted centroid. | Census (Statistics Canada) |
| Weighted dwelling density | The number of dwelling per square kilometer within a 1-km circle centered on a Dissemination Area’s (DA) population-weighted centroid. | Census (Statistics Canada) |
| Transit Stops | The number of available transit stops within 1 kilometer of population weighted centroid of the DA. | General Transit Feed Specification (GTFS) |
| Intersections with ≥3 Legs density | The number of ≥ three-way intersections on roads within 1 kilometer of population weighted centroid of the DA, excluding roads classified as motorways (highways, freeways) or slip roads (e.g., highway entrance and exit ramps) | Road Network File (Statistics Canada) |
| Weighted Points of interest | The number of points of interest (e.g., libraries, schools, hospitals) within 1 kilometer of population weighted centroid of the DA and weighted according to their importance and distance from weighted centroid of the DA. | OpenStreetMap |
Geographic Unit of Analysis
To ensure the index accurately reflects the environments that people actually live in, all measures were computed for the area within a 1 kilometer circular (Euclidean) buffer centered on the population-weighted centroid of each Dissemination Area, rather than a simple geometric centroid. This weighted centroid represents the population’s “center of mass” and was computed by taking the weighted average of the centroids of its constituent Dissemination Blocks (DBs), using the population of each block as its weight. In cases where a Dissemination Area had zero population, the geometric centroid was used instead to ensure complete coverage and prevent any area from being omitted. Finally, the Can-ALE measures were estimated within each buffer using a precise areal interpolation method at the Dissemination Area (DA) level.
Methodology, Code Implementation and Results
This section details the methodology for calculating the measures, provides the corresponding code, and presents the results. Each code link includes a readme file with a step-by-step guide to facilitate future implementation and analysis.
Weighted Population and Dwelling Densities
Population and dwelling densities were calculated by analyzing a 1 kilometer buffer around the population-weighted centroid for each dissemination area (DA) within a given Canadian province, utilizing census data acquired with the cancensus R package. Population and dwelling counts from each intersecting Dissemination Block (DB) are then proportionally allocated according to the extent of their overlap with the buffer. These summed counts are subsequently divided by the area of the buffer to provide the final density estimates for each DA.
Transit Stops
To determine the transit stop count within each DA, transit data for both the 2016 and 2021 census years were systematically acquired using automated R scripts from the TransitFeeds website, which offers a General Transit Feed Specification (GTFS) database containing details on stop locations, transit schedules, routes, and trip directions. The code was written to select representative weekdays by excluding weekends, statutory holidays, and certain non-statutory holidays. The resulting transit stop locations were then arranged by province, transit agency, and categorized into Census Metropolitan Areas (CMAs) or non-CMA areas for subsequent analysis. In contrast to Can-ALE 1.0, this work included all stops found in both CMA and non-CMA areas. Finally, the transit stop counts for each DA were calculated by tallying the stops found within the 1 kilometer buffer around each DA’s population-weighted centroid.
Intersections with ≥3 Legs density
Intersection density metrics were calculated using Statistics Canada’s road network shapefiles for 2011, 2016, and 2021. Limited-access roads (such as highways and freeways) were first excluded from each road file, after which an R script was developed to identify intersections with 3 or more legs. To improve processing speed and optimize the calculation, provincial road networks were subdivided into smaller 10 km by 10 km tiles. Within each of these tiles, intersections with three or more road segments were identified and counted, then attributed to each DA buffer. Finally, the intersection densities were aggregated and exported separately for each province.
Points of Interest
For the Points of Interest (POI) calculation, OpenStreetMap (OSM) was chosen as the primary data source for the 2006, 2011, 2016, and 2021 census years. OSM contains a wide variety of mapped features (e.g., schools, shops, parks) as both points and polygons. It offers valuable data for unique, small-scale environmental features, like benches and fountains, which are typically challenging to map but are conceptually important for active living studies. However, due to insufficient data for the 2006 census year, this year was not included in the Can-ALE 2.0 project’s ALE calculation index.
For the 2011, 2016, and 2021 census years, the first step involved converting polygon-type POIs into centroids to create a standardized data format; this was then joined with the point shapefile to produce a single POI shapefile. Second, POI categories unrelated to active living environment variables were removed based on predefined OSM classification codes. Third, two types of weighting methods were applied to the POIs in the calculation process. The first weight was applied to ensure that POIs closer to a Dissemination Area’s population-weighted centroid were more likely to be used by people than those farther away. This was accomplished by applying the negative exponential decay function ( $1.0126e^{-0.0013x}$ ), where x is the distance in meters up to a 1000-meter threshold. The second weighting method, applied to increase the robustness of the counted POIs, consisted of weighting each POI type on a scale from 1 to 4 (1 = lower relationship with active living behavior; 4 = higher relationship). Table 2 provides a sample of the weighing coefficients used, and the POIs with assigned weight of 1 are available in Appendix. Finally, the count of POIs within 1 kilometer of the population-weighted centroid was determined using spatial intersection for both weighted and un-weighted POIs. The final POI counts served as an indicator of local destination availability that is supportive of active living.
Table 2. POI Weighting System
| Weight Category 2 | Weight Category 3 | Weight Category 4 |
|---|---|---|
| Post Box | Library | School |
| Post Office | Community Centre | Park |
| Town Hall | University | Playground |
| Arts Centre | Kindergarten | Sports Centre |
| Public Building | College | Supermarket |
| Pharmacy | Dog Park | Bakery |
| Hospital | Pitch | Convenience |
| Doctors | Swimming Pool | Greengrocer |
| Dentist | Stadium | General Stores |
| Theatre | Ice Rink | Market Place |
| Cinema | Restaurant | |
| Hotel | Fast Food | |
| Motel | Cafe | |
| Bookshop | Pub | |
| Butcher | Bar | |
| Optician | Food Court | |
| Sports Shop | Biergarten | |
| Bicycle Shop | Mall | |
| Vending Machine | Department Store | |
| Vending Parking | Newsagent | |
| Bank | Bicycle Rental | |
| Atm | Picnic Site | |
| Attraction | Toilet | |
| Museum | Bench | |
| Theme Park | Bed and Breakfast | |
| Drinking Water | ||
| Waste Basket | ||
| Clinic |
A complete list of Points of Interest (POIs) assigned a weight of 1 is provided in the Supplementary Appendix 1.
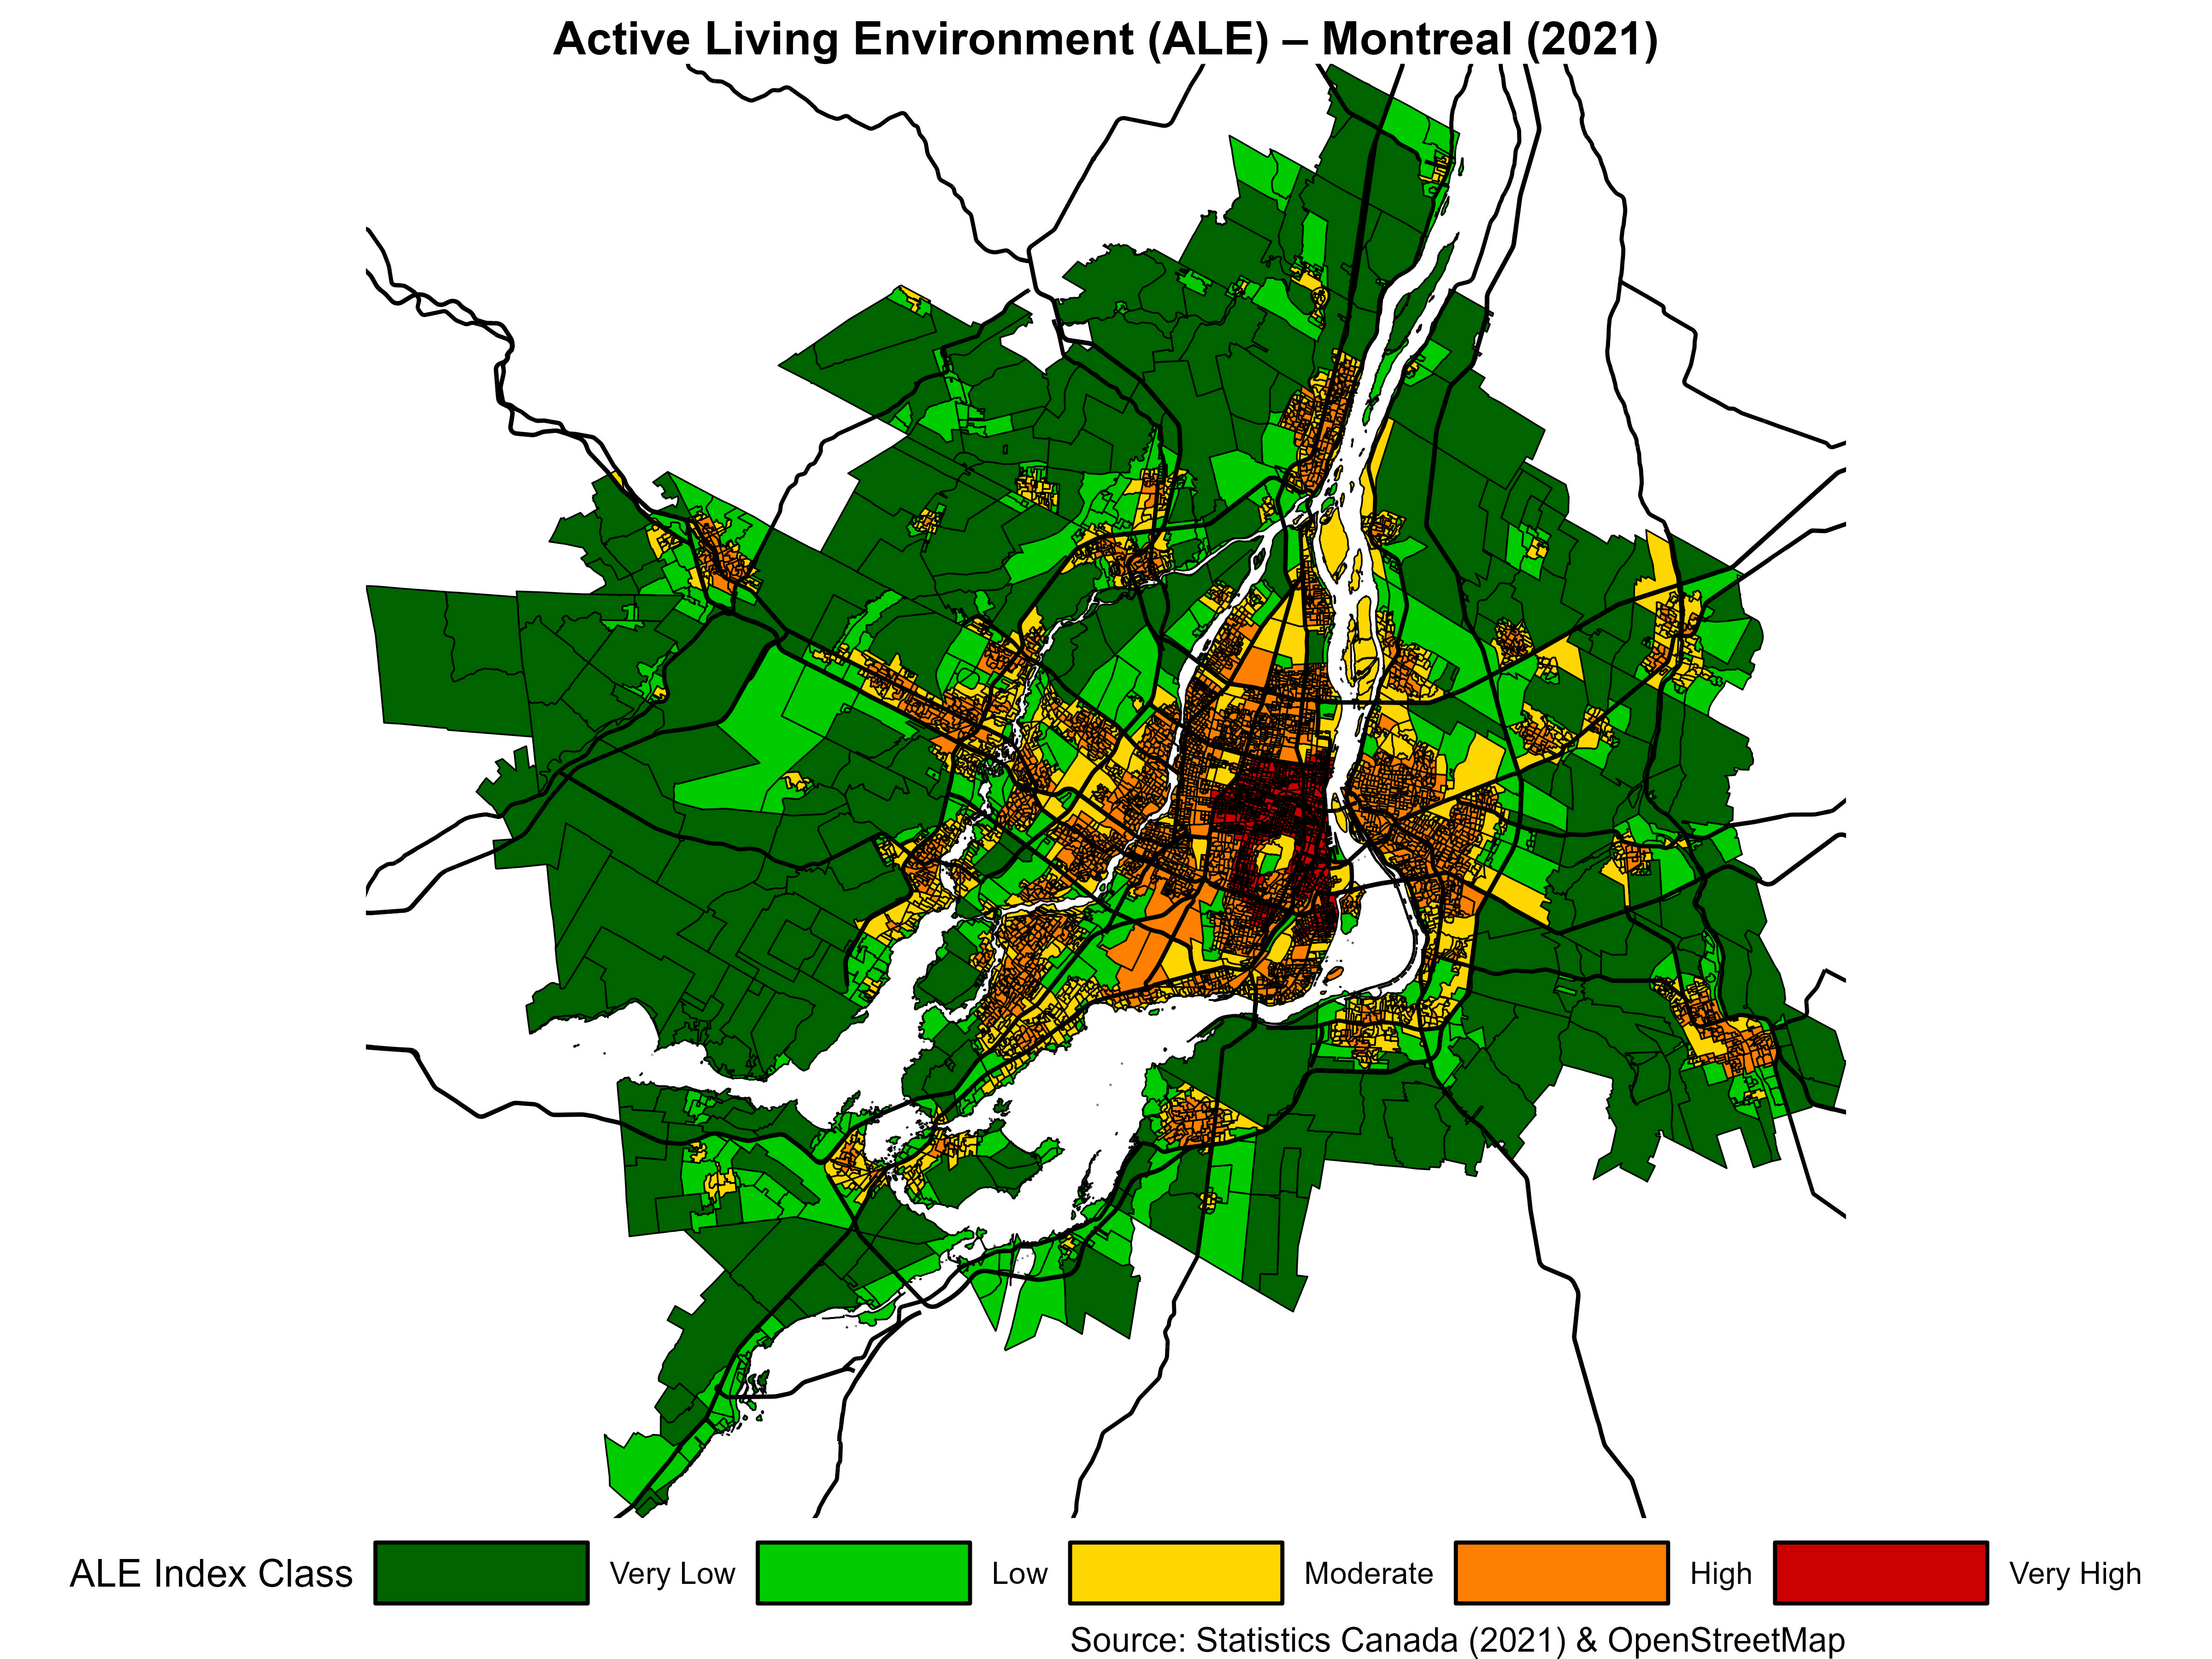
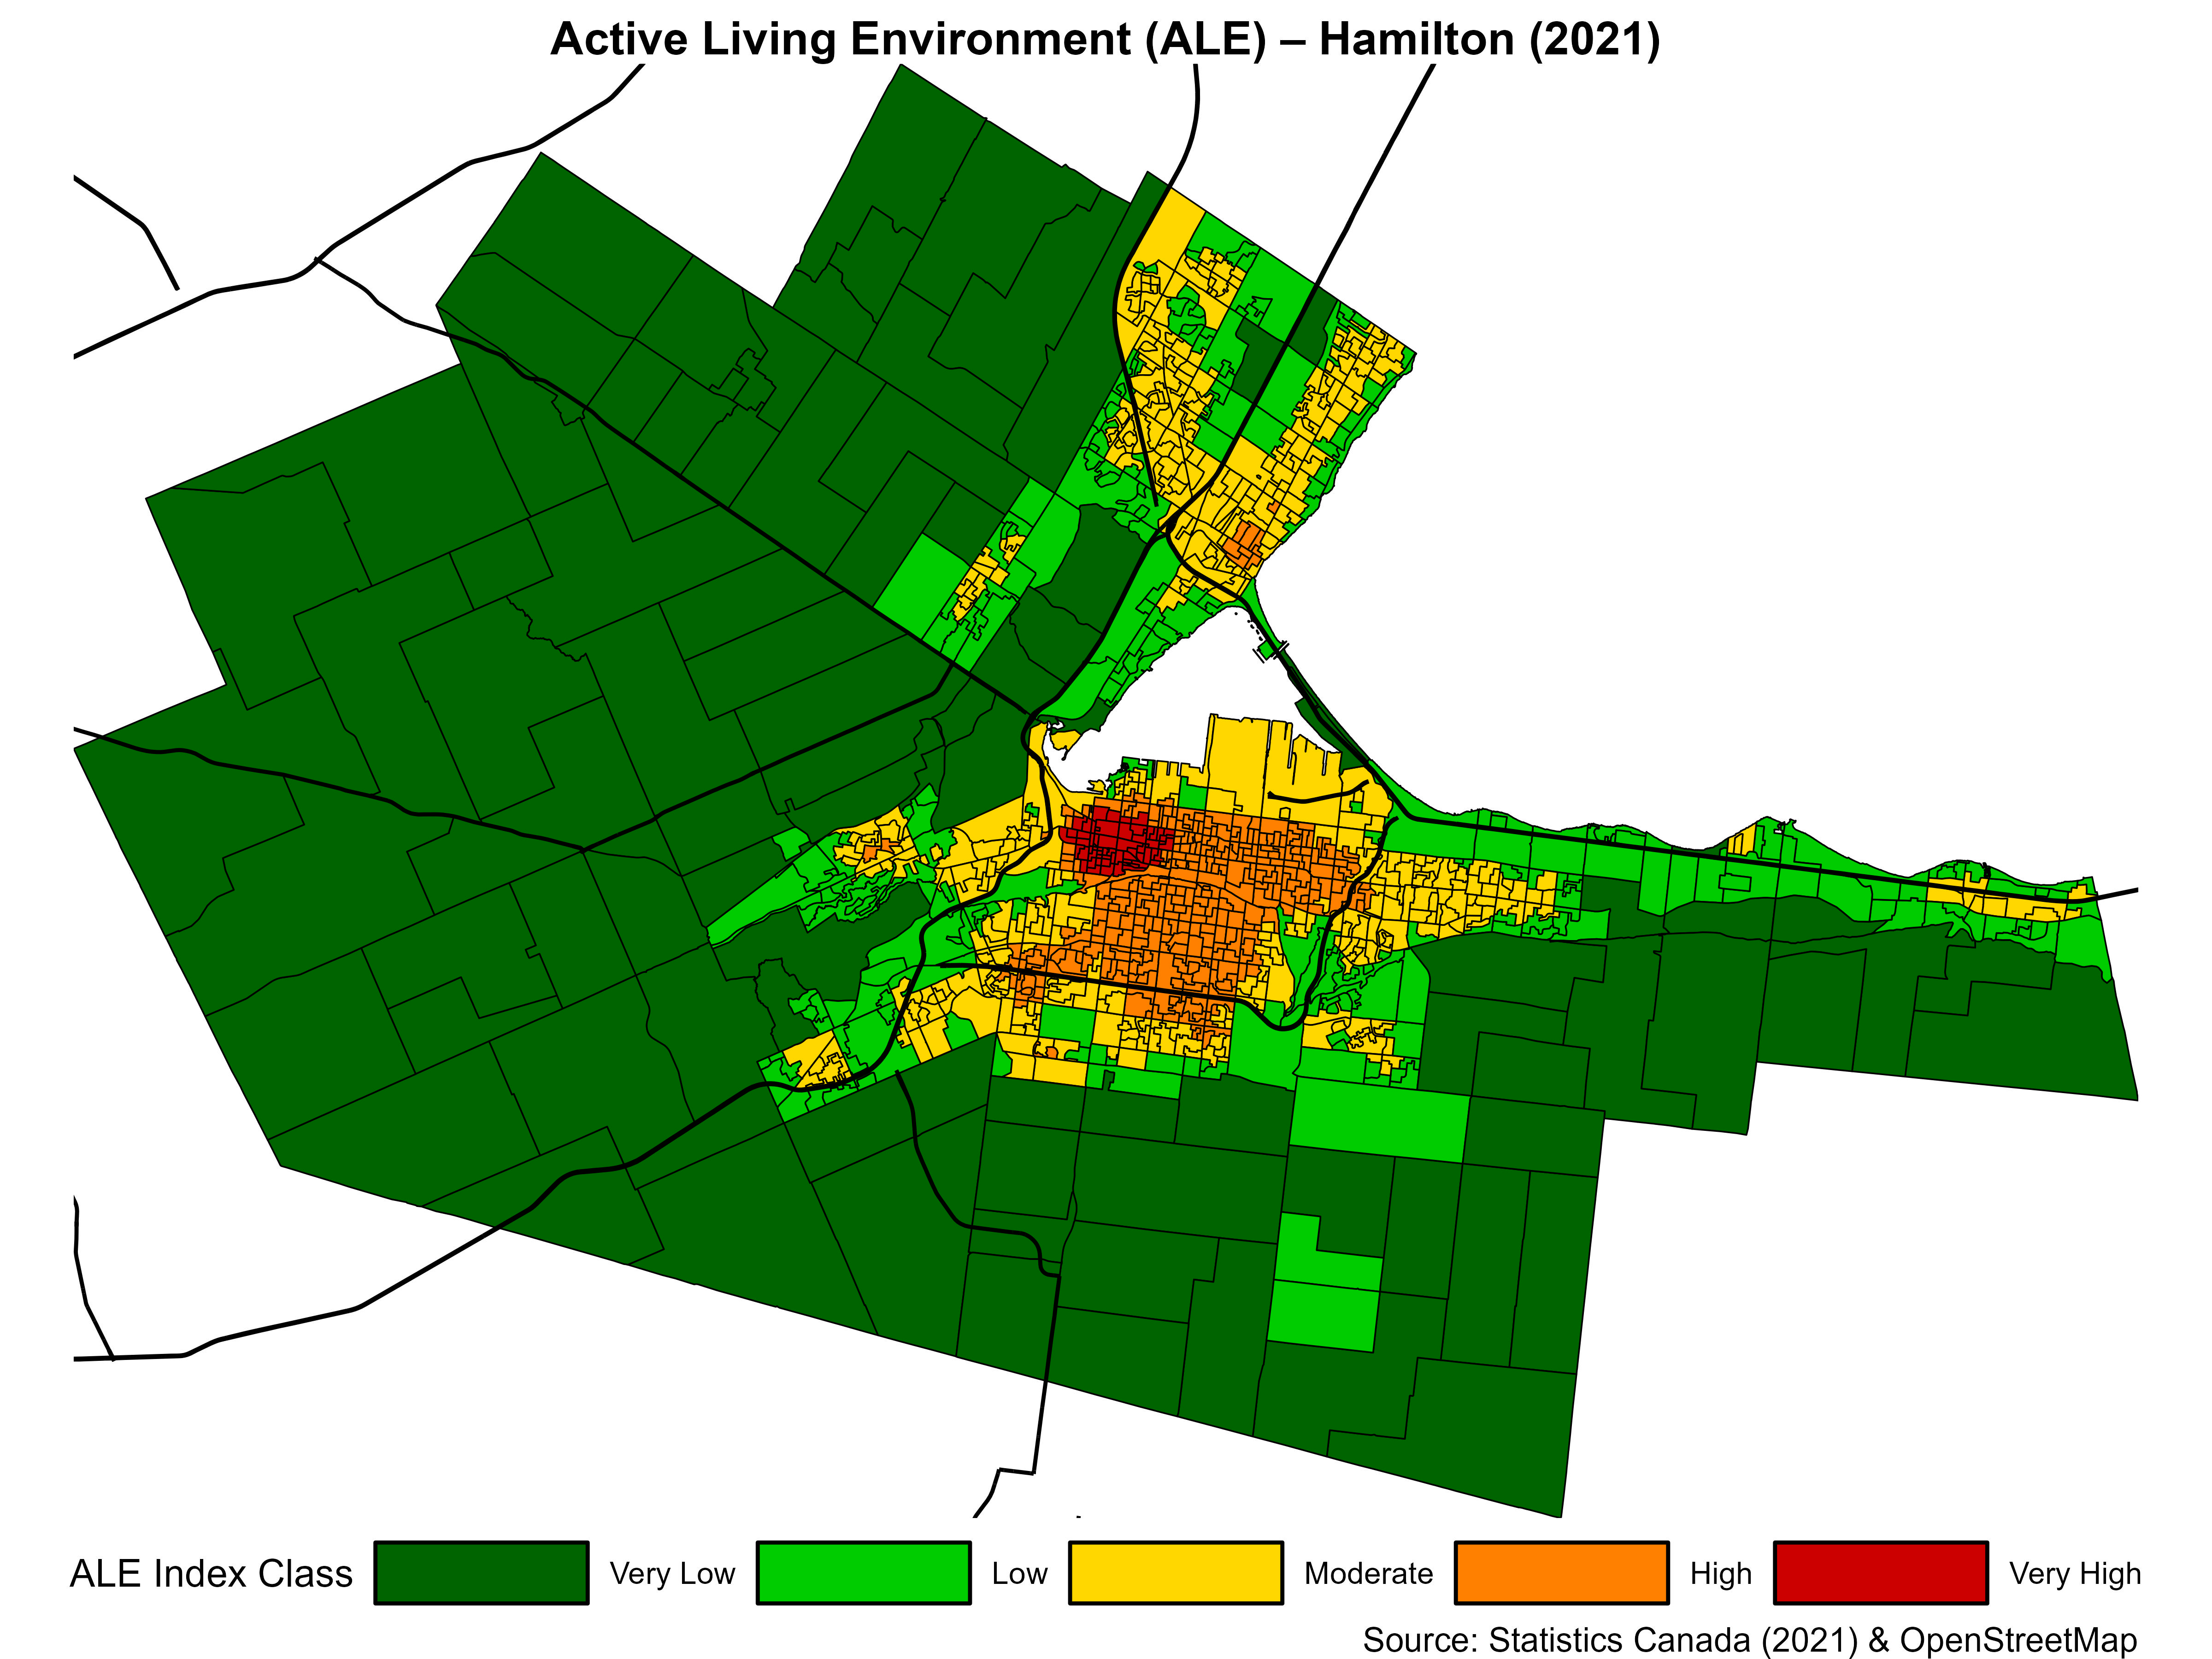
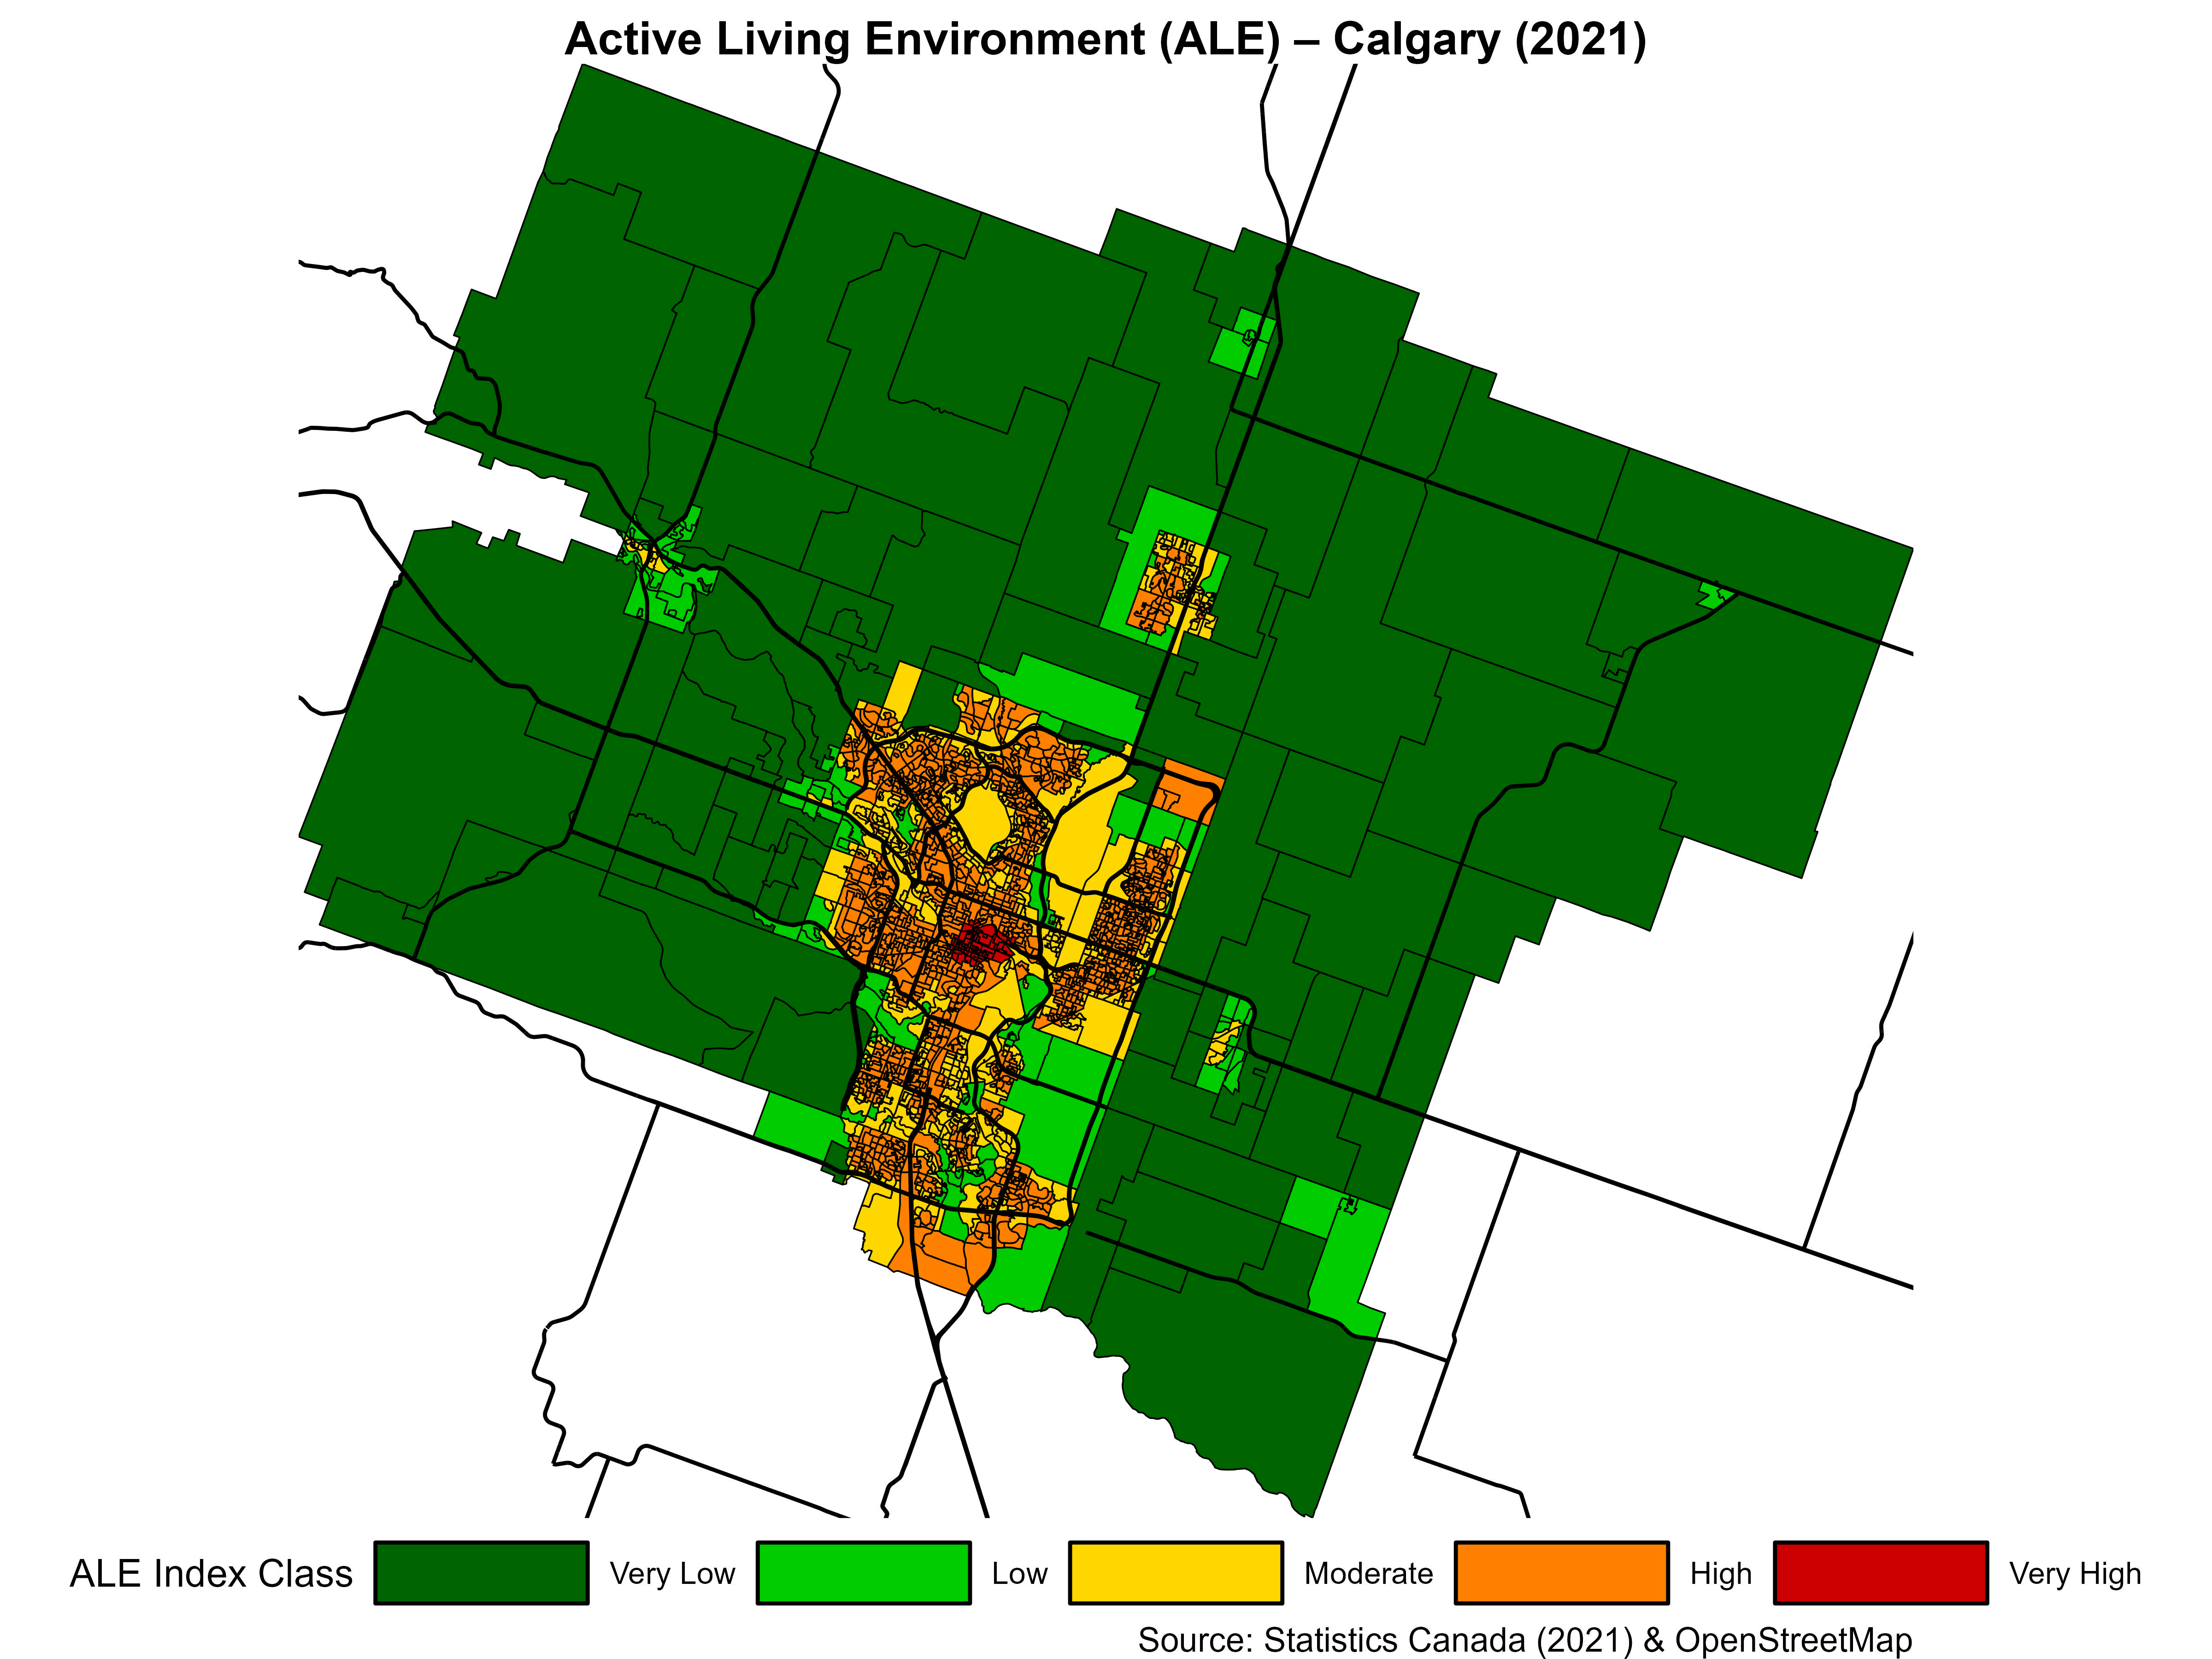
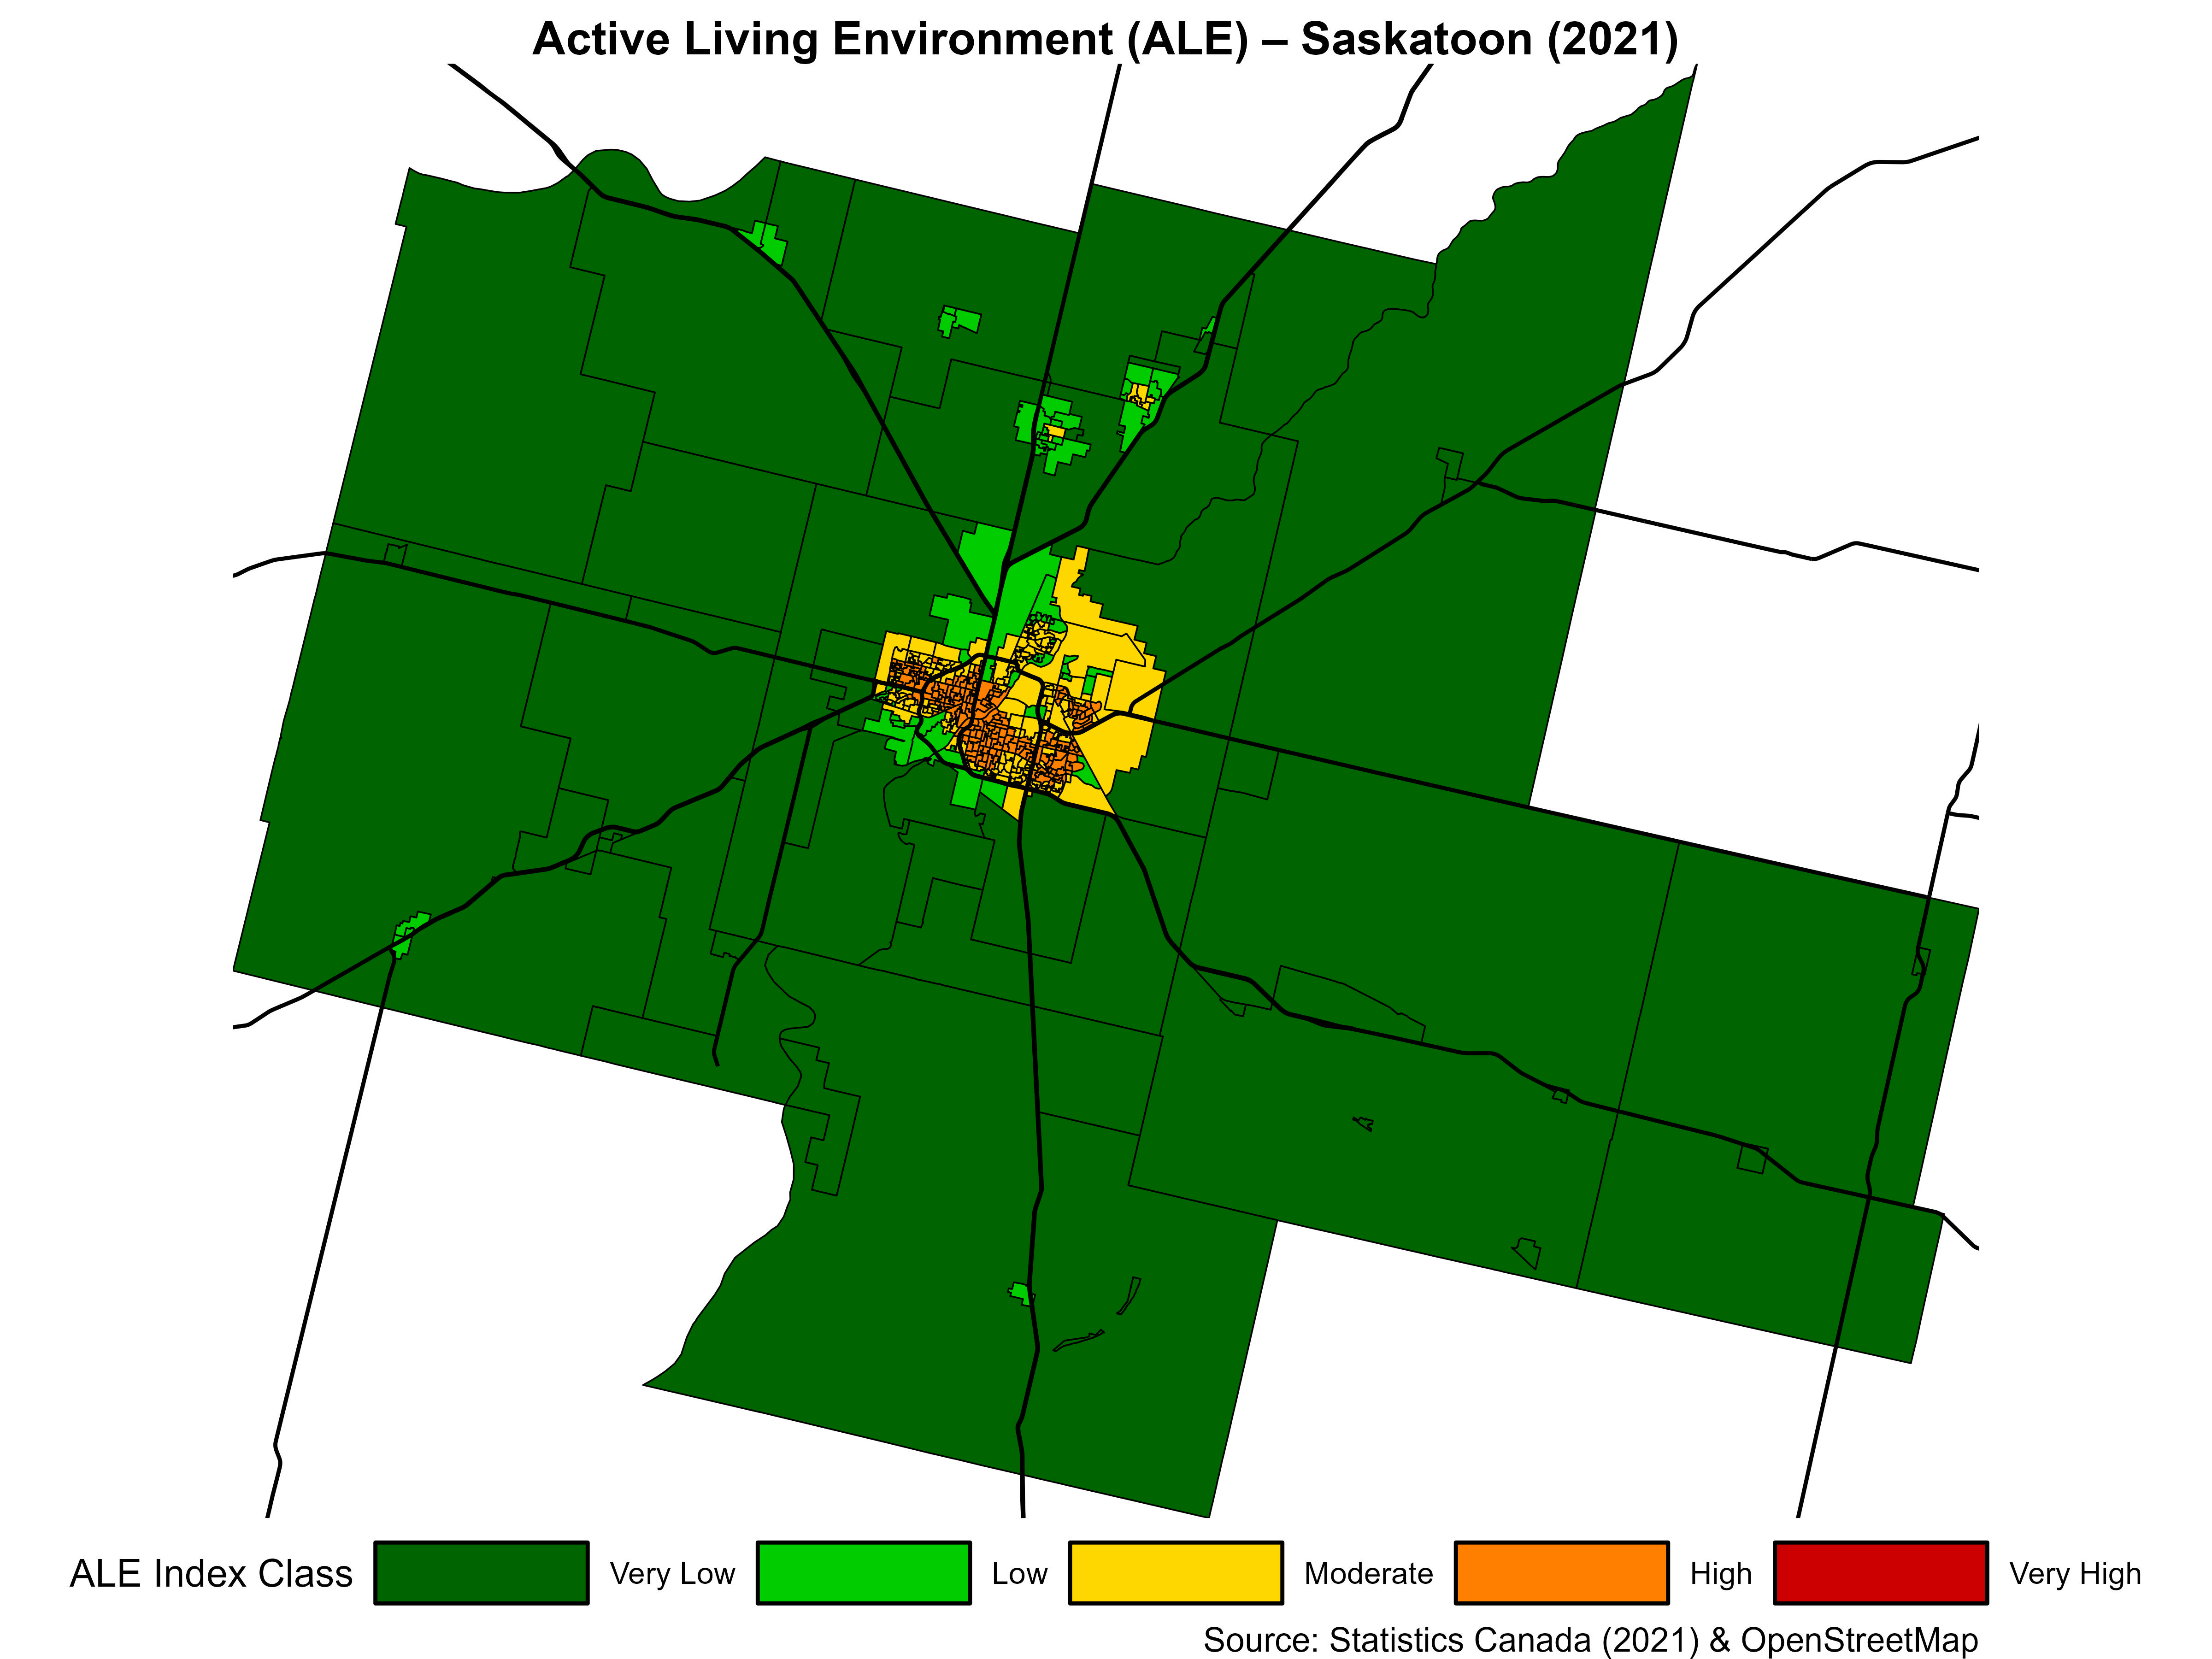
Results
The spatial distribution of ALE categories across four Canadian cities, including Montreal, Hamilton, Calgary, and Saskatoon, in 2021 is presented below:
 |
 |
 |
 |
You can find the final Can-ALE indexes and classes for each year separately through the links provided below.
- Link to Can-ALE Maps for four Canadian cities (Montreal, Hamilton, Calgary, and Saskatoon)
- Link to Final Can-ALE Files
- Link to Final Can-ALE Analysis Codes
Appendix
Table S1. Points of Interest (POIs) with a Weight of 1
| Column 1 | Column 2 | Column 3 | Column 4 |
|---|---|---|---|
| Alpine Hut | Courthouse | Memorial | Tower |
| Archaeological | Do it yourself | Mobile Phone Shop | Toy Shop |
| Artwork | Embassy | Monument | Track |
| Battlefield | Florist | Nightclub | Travel Agent |
| Beauty Shop | Fountain | Nursing Home | Vending Any |
| Beverages | Fire Station | Observation Tower | Veterinary |
| Camera Surveillance | Fort | Outdoor Shop | Video Shop |
| Camp Site | Furniture Shop | Police | Viewpoint |
| Car Dealership | Garden Centre | Prison | Wastewater Plant |
| Car Rental | Golf Course | Recycling Glass | Water Works |
| Car Repair | Gift Shop | Recycling | Water Mill |
| Car Sharing | Graveyard | Recycling Metal | Wayside Cross |
| Car Wash | Guesthouse | Recycling Clothes | Water Tower |
| Caravan Site | Hairdresser | Recycling Paper | Wayside Shrine |
| Castle | Hostel | Ruins | Water Well |
| Chalet | Hunting Stand | Shelter | Windmill |
| Chemist | Jeweler | Shoe Shop | Zoo |
| Clothes | Kiosk | Stationery | - |
| Comms Tower | Laundry | Telephone | - |
| Computer Shop | Lighthouse | Tourist Info | - |
Citation
We ask that you cite the following if you are using Can-ALE in published work.
Ghasedi, M., Fuller, D., Achot, G., Ross, N., 2025. Canadian Active Living Environments Database (Can-ALE 2.0) User Manual & Technical Document. Department of Community Health and Epidemiology, University of Saskatchewan and Department of Public Health Sciences, Queens University.